GokcencngzHR Dashboard using PowerBIThe fact that the Human Resources department correctly analyzes employee data with evaluation criteria and observes employee performance is…May 9, 20231May 9, 20231
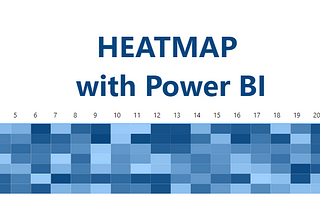
Ploii TubsamonCreate a simple heatmap with conditional formatting in Power BICreate a simple heatmap using matrix visualization.May 20, 20231May 20, 20231
InTDS ArchivebySalvatore CagliariChange your focus over time in DAX MeasuresHow to determine if your investment has paid off when you advertise products over timeMay 19, 2023May 19, 2023
InMicrosoft Power BIbyAbdulazeezabdullahBalance Sheet Report in PowerBIInvestopedia defined Financial statements as written records that convey a company’s business activities and financial performance.Oct 18, 20222Oct 18, 20222
InCloud WorkersbySalvatore CagliariBuild a Financial Income Statement in Power BIFinancial Reporting in Power BI is complex. Let’s see how we can do it with a few tricks.Apr 13, 20232Apr 13, 20232
InPower BI Use CasesbyPBI GuyPBI Use Case #6: Executive Dashboard (Part 4 of 4)Photo by Aedrian on UnsplashApr 10, 2023Apr 10, 2023
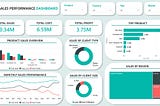
Araya PraykrasinCreating a Sales Performance Dashboard with Power BI: A University Project Case StudyMar 27, 20236Mar 27, 20236
Olowo AyodeleNETFLIX MOVIES AND TV SHOWS DASHBOARDComment and contributions are welcome.Feb 21, 2023Feb 21, 2023
Abdulwasiu TajudeenDATA CLEANING: FIFA 21 Data Cleaning and WranglingBackgroundMar 18, 20233Mar 18, 20233
InPower BI Use CasesbyPBI GuyPBI Use Case #2: Inventory Health DashboardPhoto by Martijn Baudoin on UnsplashMar 16, 20231Mar 16, 20231
Modesta UzoFIFA 2021 Data CleaningData cleaning is the process of identifying and fixing issues in a data set. The objective of data cleaning is to transform any data that…Mar 16, 20231Mar 16, 20231
InMicrosoft Power BIbyPromise ChinonsoData Cleaning: Inspecting and Wrangling the FIFA 21 DataStep-by-step process taken to transform the raw and messy FIFA 21 datasetMar 16, 20236Mar 16, 20236
Richard LiHR Analytic with Power BIAnalysis of Employee information with Data VisualizationDec 13, 20221Dec 13, 20221
ObalanatosinCase Study: Analyzing Job Market Data in Power BII’ll be analyzing a real-world job posting dataset to find insights for DataSearch, a fictional recruiting firm. I’ll explore and clean the…May 14, 20221May 14, 20221
InMicrosoft Power BIbyBolaji OlatundeCalendar Heatmap Visual in Power BI: A macgyvered approachOne of the common ways to detect or visualize seasonality in data is using a line chart or a variant of a line chart. In this post I show…Sep 23, 20228Sep 23, 20228
InMicrosoft Power BIbyAbdulazeezabdullahLeveraging Jira and PowerBI for Data-Driven Project Management SuccessData-driven decision-making is the key to project management success in today’s fast-paced business environment. Project management is a…Jan 31, 2023Jan 31, 2023
Data PearsConnect to Yahoo Finance — building a stock market tracker in Power BIAre you interested in finance? Investing? Stock Market? Just want some finance data to play with? Want to build you fancy investments…Aug 30, 20221Aug 30, 20221
Adeyemi Johnson AlbertPhoneNow Call Centre Trend Analysis With Power BIOverviewJun 22, 20221Jun 22, 20221