InMicrosoft Power BIbyAndrew Hubbard6 Expert Tips to Boost Power BI with Custom Scatter Plots.Using scatter or bubble charts in Power BI unlocks powerful insights across multiple data dimensions. These charts can turn raw numbers…Nov 4, 202468Nov 4, 202468
InMicrosoft Power BIbyDossier AnalysisExploratory Data Analysis (EDA) in Power BI: A Complete GuideExploratory Data Analysis (EDA) is a crucial step in the data science workflow. It helps uncover underlying patterns, anomalies…Sep 11, 2024211Sep 11, 2024211
InMicrosoft Power BIbyAvishek Ghosh (AV_DEVS)A Step by Step Guide to Implement Version Controlling in Power BIFrom Saving PBIX in SharePoint, to Using PBIP, VS Code, Git and Power BI’s Deployment PipelineOct 8, 20241291Oct 8, 20241291
InMicrosoft Power BIbyAkshay MishraWhich Power BI License Do You Need?The ultimate licensing guide for Power BI with cost calculation in different scenarios.Sep 27, 20242472Sep 27, 20242472
InMicrosoft Power BIbyMohammed Azarudeen Bilal39 Power BI Interview Questions You Didn’t Expect 😧Unwrap the Answers to Land Your Dream Job 🚀Aug 31, 20242311Aug 31, 20242311
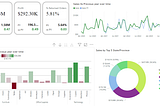
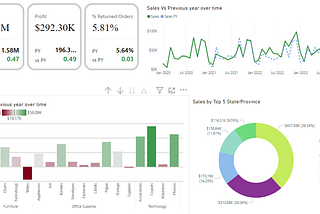
InMicrosoft Power BIbySai KrupaSuperstore Sales Analysis: A Comprehensive Dashboard for Data-Driven InsightsIn today’s data-driven business environment, having access to detailed and actionable insights can make the difference between success and…Sep 10, 20241.4K14Sep 10, 20241.4K14
InMicrosoft Power BIbyGökberk UzuntaşPower BI Hidden Treasure: Incremental RefreshIncremental Refresh in Power BI is a powerful feature that allows you to refresh datasets efficiently by updating only a portion of the…Sep 11, 2024682Sep 11, 2024682
InMicrosoft Power BIbyDossier AnalysisA Guide to Dataflows in Power BIDataflows are a powerful feature that allows you to handle, clean, and transform data efficiently. They help organizations centralize data…Sep 20, 202414Sep 20, 202414
InMicrosoft Power BIbyAvishek Ghosh (AV_DEVS)Dynamic Legend in Power BIDynamically Change Legends on Column Charts Using Slicer to Show Composition of Value Using Different DimensionsSep 5, 202466Sep 5, 202466
InMicrosoft Power BIbyShashanka ShekharModernize your Bar Charts with all details on Top of the Bars in Power BIPower BI is a platform that allows you to connect to various data sources, transform and model your data, and create interactive dashboards…Sep 11, 2024109Sep 11, 2024109
InMicrosoft Power BIbyMateusz MossakowskiEnhancing Slicer Functionality in Power BI: Introducing Conditional SlicersRecently, I came across an insightful video by Roland Szirmai from BI-Lingual Analytics that discussed the concept of conditionally hiding…Sep 13, 202425Sep 13, 202425
InMicrosoft Power BIbyGökberk UzuntaşUtilizing Field Parameters & Dynamic Title Change in Power BILearn how to use Field Parameters and Dynamic Title Change in Power BI. Discover how to create dashboards with adjustable titles based on…May 14, 20241321May 14, 20241321
InMicrosoft Power BIbyAndrew Hubbard7 Powerful Ways Layout and Alignment Impact Power BI DashboardsWhen creating a Power BI dashboard design, you can easily get caught up in the data itself. The metrics, KPIs and the visuals to use…Sep 17, 202465Sep 17, 202465
InMicrosoft Power BIbyShashanka ShekharRanking a Multi Level Matrix in Power BICreating a multi-level matrix in Power BI can be a game-changer for data analysts and business intelligence professionals. This article…Oct 3, 2024911Oct 3, 2024911
InMicrosoft Power BIbyData Intelligence HubDAX Mastery: Information Functions (Day 9)Imagine you’re the data analyst of operations in a large corporate library system, tasked with ensuring that all books, research papers…Sep 15, 202467Sep 15, 202467
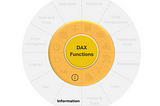
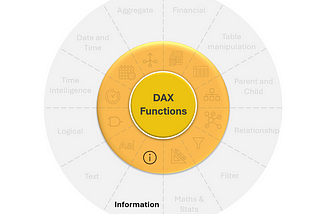
InMicrosoft Power BIbyGökberk UzuntaşMastering Power BI DAX Functions: From Basics to Real-World CasesExplore Power BI DAX functions with practical examples. Learn basic functions like CALCULATE, ALL, ALLSELECTED, ALLEXCEPT, DIVIDE, IF, and…Oct 16, 202346Oct 16, 202346
InMicrosoft Power BIbyGökberk UzuntaşPower BI with SharePoint — Images and ReportsIntroductionDec 25, 202380Dec 25, 202380
InMicrosoft Power BIbyAkshay MishraWhy Is Power BI the Best BI Tool Out ThereThis blog is for anyone starting or looking to start their journey in the BI spaceSep 9, 20242298Sep 9, 20242298
InMicrosoft Power BIbyIwa SanjayaHow to Craft Compelling Infographics for Data Analysts [Part 1]This article outlines the process of creating one of the infographics featured in my reports. The infographic combines a 100% stacked bar…Sep 18, 20241152Sep 18, 20241152
InMicrosoft Power BIbyGökberk UzuntaşPython — Power BI IntegrationWhat is Python and Power BI and what are the benefits of using it?Dec 13, 20221042Dec 13, 20221042


![How to Craft Compelling Infographics for Data Analysts [Part 1]](https://miro.medium.com/v2/resize:fill:160:106/1*y18ZSg0FIoqT5S6OdJ3xpA.jpeg)
![How to Craft Compelling Infographics for Data Analysts [Part 1]](https://miro.medium.com/v2/resize:fill:320:214/1*y18ZSg0FIoqT5S6OdJ3xpA.jpeg)

