Jeet Patel10 Power Bi DAX formulas essential for Data modelling.In Power BI, I’ve constructed a loan data model dashboard using DAX formulas to create a loan framework centered on mortgage interest…Jan 8, 2024901Jan 8, 2024901
Chris HillEasily connecting between Power Query / Power BI and Microsoft GraphA while ago I was experimenting with Power Query in Microsoft Excel, and was excited by the functionality that allows you to import live…Dec 3, 20207415Dec 3, 20207415
InMicrosoft Power BIbyDr. Alvin AngRelationshipsPart 6a of Learning Power BI by Dr. Alvin AngMay 29, 2023181May 29, 2023181
Nikola IlicMicrosoft Fabric — Beyond Hype and Marketing!Microsoft just announced their brand new data solution! But, is it really new? Or, is it simply rebranding of the existing offering? In…Jun 2, 20232453Jun 2, 20232453
Abinayagobinath MButtons,Tooltip,Dynamic charts everything in Power BI dashboard.When i was working in Power BI i came up with large number of insights, so i wanted to create a multiple charts in the same dashboard that…May 23, 2023152May 23, 2023152
Andrei Khaidarov, Microsoft MVP, PhDMastering CALCULATE in DAX: Tips, Tricks, and ExamplesCALCULATE is a powerful function in DAX that allows users to manipulate the context in which a calculation is performed. By doing so, you…Apr 20, 2023912Apr 20, 2023912
Anirban Mukherjee ✍️Business Analyst BasicsToday, I am gonna cover the basic things about Business Analysis. So, First of all, start with the Business Analysis IIBA(International…Mar 3, 2023591Mar 3, 2023591
InPower PlatformbyAndrei Khaidarov, Microsoft MVP, PhDRevolutionizing Data Analytics: Introducing Microsoft Fabric and Copilot in Power BIMicrosoft Fabric: The Future of Data AnalyticsMay 23, 202350May 23, 202350
ChristianlauerMicrosoft announces better Power BI Integration with OneDrive and SharePointHow Microsoft wants to ease Data Sharing within Companies and TeamsMay 11, 2023121May 11, 2023121
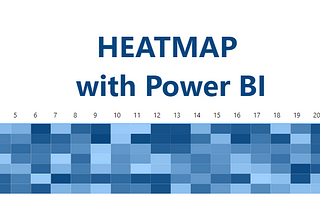
Ploii TubsamonCreate a simple heatmap with conditional formatting in Power BICreate a simple heatmap using matrix visualization.May 20, 2023161May 20, 2023161
InTDS ArchivebySalvatore CagliariChange your focus over time in DAX MeasuresHow to determine if your investment has paid off when you advertise products over timeMay 19, 202375May 19, 202375
InGoPenAIbyAndrei Khaidarov, Microsoft MVP, PhDMaximizing Efficiency in DAX Querying with ChatGPT Integration in Power BIData analysis expressions (DAX) is a powerful formula language used in Power BI for creating custom calculations and aggregations. However…Apr 24, 2023613Apr 24, 2023613
Nilimesh Halder, PhDMastering the Art of Storytelling Dashboards: Top Tips and Best PracticesIn the world of data visualization, storytelling dashboards are a powerful tool for conveying complex information in an easily digestible…Mar 29, 20231Mar 29, 20231
ZIRUPower BI vs Tableau: Comparing Report for Data ScientistsSimilaritiesMay 12, 202330May 12, 202330
Gus FrazerWhat the heck is Query Folding in Power BI?!?Power BI is a powerful data visualization and analysis tool that allows users to connect to a wide variety of data sources. When creating a…May 11, 202341May 11, 202341
Raghavan PHow does a Data Analyst job role look like?Are you trying to get into data analytics but not sure what a data analyst does in their day-to-day job?May 10, 202335May 10, 202335
InMicrosoft Power BIbyMonika MishraMerge/Join Two Tables in Power Query : Power BIBackgroundMay 3, 202316May 3, 202316
InMicrosoft Power BIbyParth LadCalculated Columns in Power BIHow to create and use Calculated Columns.May 5, 202354May 5, 202354
InMicrosoft Power BIbyMonika MishraUnion/Append Two Tables in Power QueryBackgroundApr 14, 2023151Apr 14, 2023151